Áreas temáticas UCA 2015-2019 – Scopus y WOS
Producción de la UCA por áreas temáticas en 2015-2019 – Scopus
| Áreas | Publ. | Citas | Citas por publ. | FWCI | % Col. Int. | Impacto Col. |
| Agricultural and Biological Sciences | 614 | 5693 | 9,3 | 1,34 | 61,60% | 10,4 |
| Arts and Humanities | 325 | 439 | 1,4 | 0,73 | 11,40% | 5,9 |
| Biochemistry, Genetics and Molecular Biology | 453 | 4050 | 8,9 | 0,98 | 47% | 10,5 |
| Business, Management and Accounting | 151 | 1535 | 10,2 | 1,53 | 23,80% | 13,6 |
| Chemical Engineering | 290 | 3699 | 12,8 | 1,21 | 50% | 14,9 |
| Chemistry | 507 | 5589 | 11 | 1,17 | 50,70% | 12,2 |
| Computer Science | 554 | 3044 | 5,5 | 0,97 | 36,30% | 6,7 |
| Decision Sciences | 134 | 1139 | 8,5 | 1,08 | 35,10% | 12,3 |
| Dentistry | 3 | 18 | 6 | 0,98 | 33,30% | 12 |
| Earth and Planetary Sciences | 326 | 7125 | 21,9 | 2,41 | 70,60% | 29,1 |
| Economics, Econometrics and Finance | 72 | 393 | 5,5 | 0,95 | 19,40% | 4,2 |
| Energy | 187 | 2404 | 12,9 | 1,34 | 36,90% | 11,4 |
| Engineering | 582 | 4023 | 6,9 | 1,02 | 35,90% | 7,4 |
| Environmental Science | 578 | 7365 | 12,7 | 1,48 | 52,90% | 13,4 |
| Health Professions | 90 | 698 | 7,8 | 1,39 | 47,80% | 11,3 |
| Immunology and Microbiology | 110 | 1113 | 10,1 | 1 | 37,30% | 14,2 |
| Materials Science | 340 | 2272 | 6,7 | 0,86 | 49,70% | 6,1 |
| Mathematics | 558 | 2471 | 4,4 | 1,01 | 40,70% | 5,4 |
| Medicine | 1192 | 7683 | 6,4 | 0,99 | 28,30% | 10,7 |
| Multidisciplinary | 97 | 1633 | 16,8 | 1,33 | 52,60% | 22,4 |
| Neuroscience | 81 | 797 | 9,8 | 1,01 | 32,10% | 14,1 |
| Nursing | 117 | 493 | 4,2 | 0,73 | 30,80% | 5,6 |
| Pharmacology, Toxicology and Pharmaceutics | 133 | 1314 | 9,9 | 1,28 | 44,40% | 11,3 |
| Physics and Astronomy | 394 | 7243 | 18,4 | 1,98 | 55,10% | 28,7 |
| Psychology | 129 | 715 | 5,5 | 0,94 | 23,30% | 6,5 |
| Social Sciences | 611 | 2324 | 3,8 | 0,94 | 16,70% | 6,9 |
| Veterinary | 10 | 92 | 9,2 | 1,75 | 30% | 14 |
Se analizan a continuación las publicaciones del periodo 2015-2019 en función del impacto y la excelencia de las publicaciones, indicando el número y porcentaje de publicaciones en primer cuartil (Q1), número y porcentaje de publicaciones situadas en el Top10% y Top1% más citados a nivel mundial.
| Áreas | Publ. | Q1 | % Q1 | Top 10% | % Top 10% | Top 1% | % Top 1% |
| Agricultural and Biological Sciences | 614 | 442 | 72,70% | 90 | 14,70% | 4 | 0,70% |
| Arts and Humanities | 325 | 68 | 21,50% | 29 | 8,90% | 4 | 1,20% |
| Biochemistry, Genetics and Molecular Biology | 453 | 290 | 64,60% | 33 | 7,30% | 2 | 0,40% |
| Business, Management and Accounting | 151 | 72 | 50,70% | 30 | 19,90% | 4 | 2,60% |
| Chemical Engineering | 290 | 225 | 78,90% | 27 | 9,30% | 1 | 0,30% |
| Chemistry | 507 | 412 | 81,70% | 46 | 9,10% | 4 | 0,80% |
| Computer Science | 554 | 175 | 38,50% | 61 | 11% | 4 | 0,70% |
| Decision Sciences | 134 | 62 | 59% | 15 | 11,20% | 2 | 1,50% |
| Dentistry | 3 | 2 | 66,70% | 0 | 0 | 0 | 0 |
| Earth and Planetary Sciences | 326 | 233 | 73% | 56 | 17,20% | 7 | 2,10% |
| Economics, Econometrics and Finance | 72 | 27 | 39,10% | 7 | 9,70% | 1 | 1,40% |
| Energy | 187 | 144 | 87,30% | 25 | 13,40% | 1 | 0,50% |
| Engineering | 582 | 309 | 62,20% | 61 | 10,50% | 3 | 0,50% |
| Environmental Science | 578 | 452 | 79,90% | 99 | 17,10% | 2 | 0,30% |
| Health Professions | 90 | 51 | 59,30% | 17 | 18,90% | 2 | 2,20% |
| Immunology and Microbiology | 110 | 56 | 50,90% | 10 | 9,10% | 1 | 0,90% |
| Materials Science | 340 | 201 | 60,90% | 17 | 5% | 1 | 0,30% |
| Mathematics | 558 | 220 | 42,40% | 67 | 12% | 4 | 0,70% |
| Medicine | 1192 | 458 | 38,80% | 112 | 9,40% | 10 | 0,80% |
| Multidisciplinary | 97 | 93 | 95,90% | 13 | 13,40% | 4 | 4,10% |
| Neuroscience | 81 | 57 | 70,40% | 4 | 4,90% | 0 | 0 |
| Nursing | 117 | 50 | 42,70% | 7 | 6% | 0 | 0 |
| Pharmacology, Toxicology and Pharmaceutics | 133 | 88 | 66,70% | 14 | 10,50% | 2 | 1,50% |
| Physics and Astronomy | 394 | 264 | 69,80% | 40 | 10,20% | 11 | 2,80% |
| Psychology | 129 | 40 | 31% | 14 | 10,90% | 0 | 0 |
| Social Sciences | 611 | 202 | 34,80% | 62 | 10,10% | 9 | 1,50% |
| Veterinary | 10 | 7 | 70% | 3 | 30% | 0 | 0 |
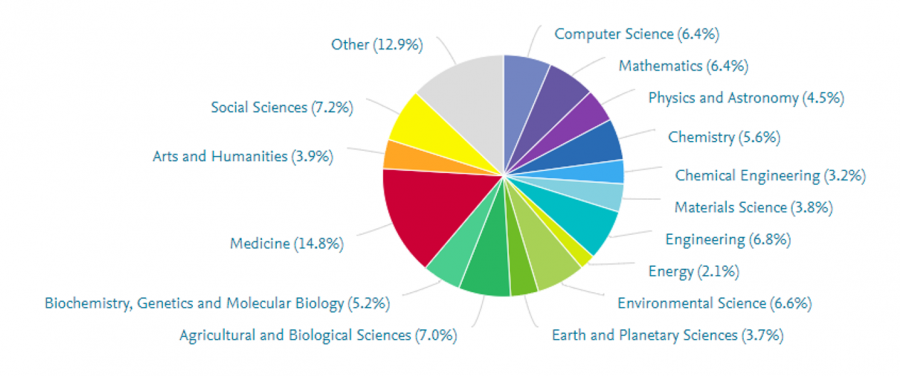
Distribución de áreas temáticas Scopus en la UCA

Fuente: Scopus-SciVal (30 de Septiembre de 2020)
Producción de la UCA por áreas temáticas en 2015-2019 – Web of Science
En la siguiente tabla se muestran las áreas por orden alfabético, indicando para cada una de ellas: el número de publicaciones, las citas conseguidas, la media de citas por publicación, el factor de impacto normalizado y el porcentaje de publicaciones realizadas en colaboración internacional.
| Áreas | Publ. | Citas | Citas por Publ. | Category Normalized Impact Factor | % Col. Int. |
| Agricultural Sciences | 143 | 1122 | 7,85 | 1,31 | 37,06% |
| Biology & Biochemistry | 131 | 1153 | 8,8 | 0,89 | 51,15% |
| Chemistry | 348 | 3391 | 9,74 | 0,94 | 49,71% |
| Clinical Medicine | 546 | 3254 | 5,96 | 0,87 | 30,59% |
| Computer Science | 114 | 1171 | 10,27 | 1,08 | 48,25% |
| Economics & Business | 69 | 320 | 4,64 | 1,11 | 8,70% |
| Engineering | 312 | 2537 | 8,13 | 0,96 | 33,65% |
| Environment/Ecology | 379 | 4126 | 10,89 | 1,3 | 61,21% |
| Geosciences | 97 | 838 | 8,64 | 0,85 | 71,13% |
| Immunology | 63 | 303 | 4,81 | 0,58 | 20,63% |
| Materials Science | 202 | 1211 | 6 | 0,63 | 51,49% |
| Mathematics | 221 | 675 | 3,05 | 0,95 | 38,91% |
| Microbiology | 22 | 274 | 12,45 | 1,13 | 45,45% |
| Molecular Biology & Genetics | 39 | 302 | 7,74 | 0,97 | 53,85% |
| Neuroscience & Behavior | 81 | 800 | 9,88 | 0,95 | 37% |
| Pharmacology & Toxicology | 60 | 501 | 8,35 | 1,18 | 46,67% |
| Physics | 107 | 751 | 7,02 | 0,72 | 53,27% |
| Plant & Animal Science | 251 | 1519 | 6,05 | 1,09 | 68,53% |
| Psychiatry/Psychology | 120 | 776 | 6,47 | 1,1 | 34,17% |
| Social Sciences, General | 192 | 896 | 4,67 | 1,15 | 26,56% |
| Space Science | 47 | 5713 | 121,55 | 11,2 | 85,11% |
Se analizan a continuación las publicaciones del periodo 2015-2019 en función del impacto y la excelencia de las publicaciones, indicando el número y porcentaje de publicaciones situadas en el Top 10%, en el Top 1% y los Highly Cited Papers (documentos altamente citados).
| Áreas | Publ. | Q1 | % Q1 | Top 10% | %Top 10% | Top 1% | %Top 1% | Highly Cited Papers |
| Agricultural Sciences | 143 | 87 | 61,27% | 20 | 13,99% | 4 | 2,80% | 3 |
| Biology & Biochemistry | 131 | 77 | 58,78% | 8 | 6,11% | 0 | 0% | 0 |
| Chemistry | 348 | 207 | 60,17% | 24 | 6,90% | 2 | 1% | 1 |
| Clinical Medicine | 546 | 190 | 34,86% | 47 | 8,61% | 2 | 0% | 0 |
| Computer Science | 114 | 61 | 53,98% | 7 | 6,14% | 1 | 0,88% | 2 |
| Economics & Business | 69 | 20 | 32,26% | 6 | 8,70% | 1 | 1,45% | 1 |
| Engineering | 312 | 187 | 59,94% | 30 | 9,62% | 0 | 0% | 1 |
| Environment/Ecology | 379 | 226 | 60,11% | 50 | 13,19% | 5 | 1,32% | 4 |
| Geosciences | 97 | 48 | 51,06% | 6 | 6,19% | 0 | 0% | 0 |
| Immunology | 63 | 27 | 42,86% | 1 | 1,59% | 0 | 0% | 0 |
| Materials Science | 202 | 124 | 61,69% | 3 | 1% | 0 | 0% | 0 |
| Mathematics | 221 | 59 | 26,82% | 16 | 7,24% | 0 | 0% | 0 |
| Microbiology | 22 | 7 | 31,82% | 2 | 9,09% | 1 | 4,55% | 1 |
| Molecular Biology & Genetics | 39 | 16 | 43,24% | 2 | 5,13% | 1 | 2,56% | 1 |
| Multidisciplinary | 3 | 1 | 66,67% | 0 | 0% | 0 | 0% | 0 |
| Neuroscience & Behavior | 81 | 47 | 58,02% | 7 | 8,64% | 0 | 0% | 1 |
| Pharmacology & Toxicology | 60 | 34 | 56,67% | 7 | 11,67% | 1 | 1,67% | 1 |
| Physics | 107 | 43 | 40,19% | 3 | 2,80% | 1 | 0,93% | 1 |
| Plant & Animal Science | 251 | 118 | 48,16% | 24 | 9,56% | 0 | 0% | 0 |
| Psychiatry/Psychology | 120 | 34 | 28,57% | 9 | 7,50% | 2 | 1,67% | 3 |
| Social Sciences, General | 192 | 61 | 32,45% | 15 | 7,81% | 4 | 2,08% | 4 |
| Space Science | 47 | 43 | 91,49% | 13 | 27,66% | 7 | 14,89% | 7 |
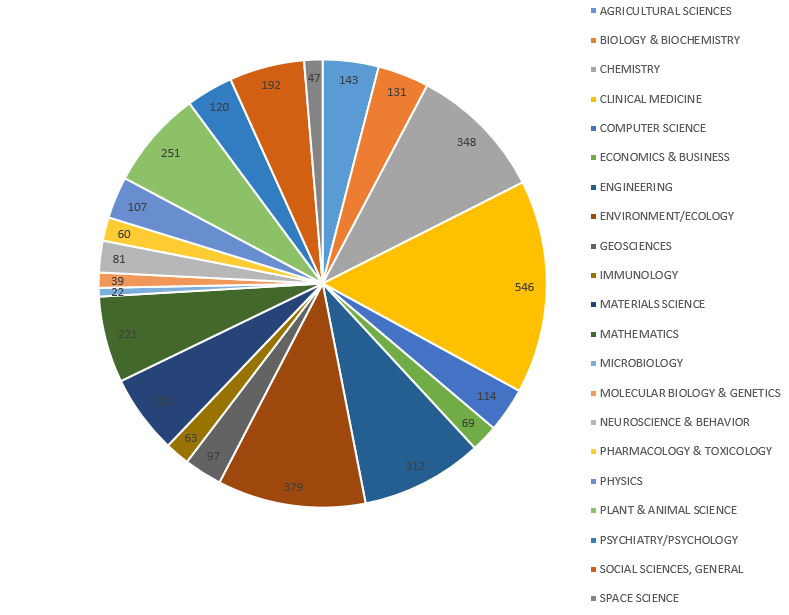
Distribución de áreas temáticas WOS (clasificación ESI) en la UCA

Fuente: WOS – Incites (31 de Agosto de 2020)

